CARD
Background
In recent years, the advances of transcriptomics technologies have allowed us to perform gene expression profiling on many tissue locations with spatial localization information1, enabling the characterization of the transcriptomic landscape on complex tissues. However, most technologies, in particular the sequencing-based ones, are often of limited spatial resolution as they collect gene expression measurements on tissue locations that contain a mixture of cells belonging to potentially heterogeneous cell populations. Consequently, performing cell type deconvolution to obtain the cell type composition at each spatial location can help disentangle the spatial localization or colocalization of cell types and characterize the complex tissue architecture. In addition, constructing a high-resolution map for either cell type composition and gene expression beyond the spatial resolution obtainable using the existing technologies is also critically important for revealing the precise spatial distribution of cell types and accurate spatial expression pattern of genes.
Overview of CARD
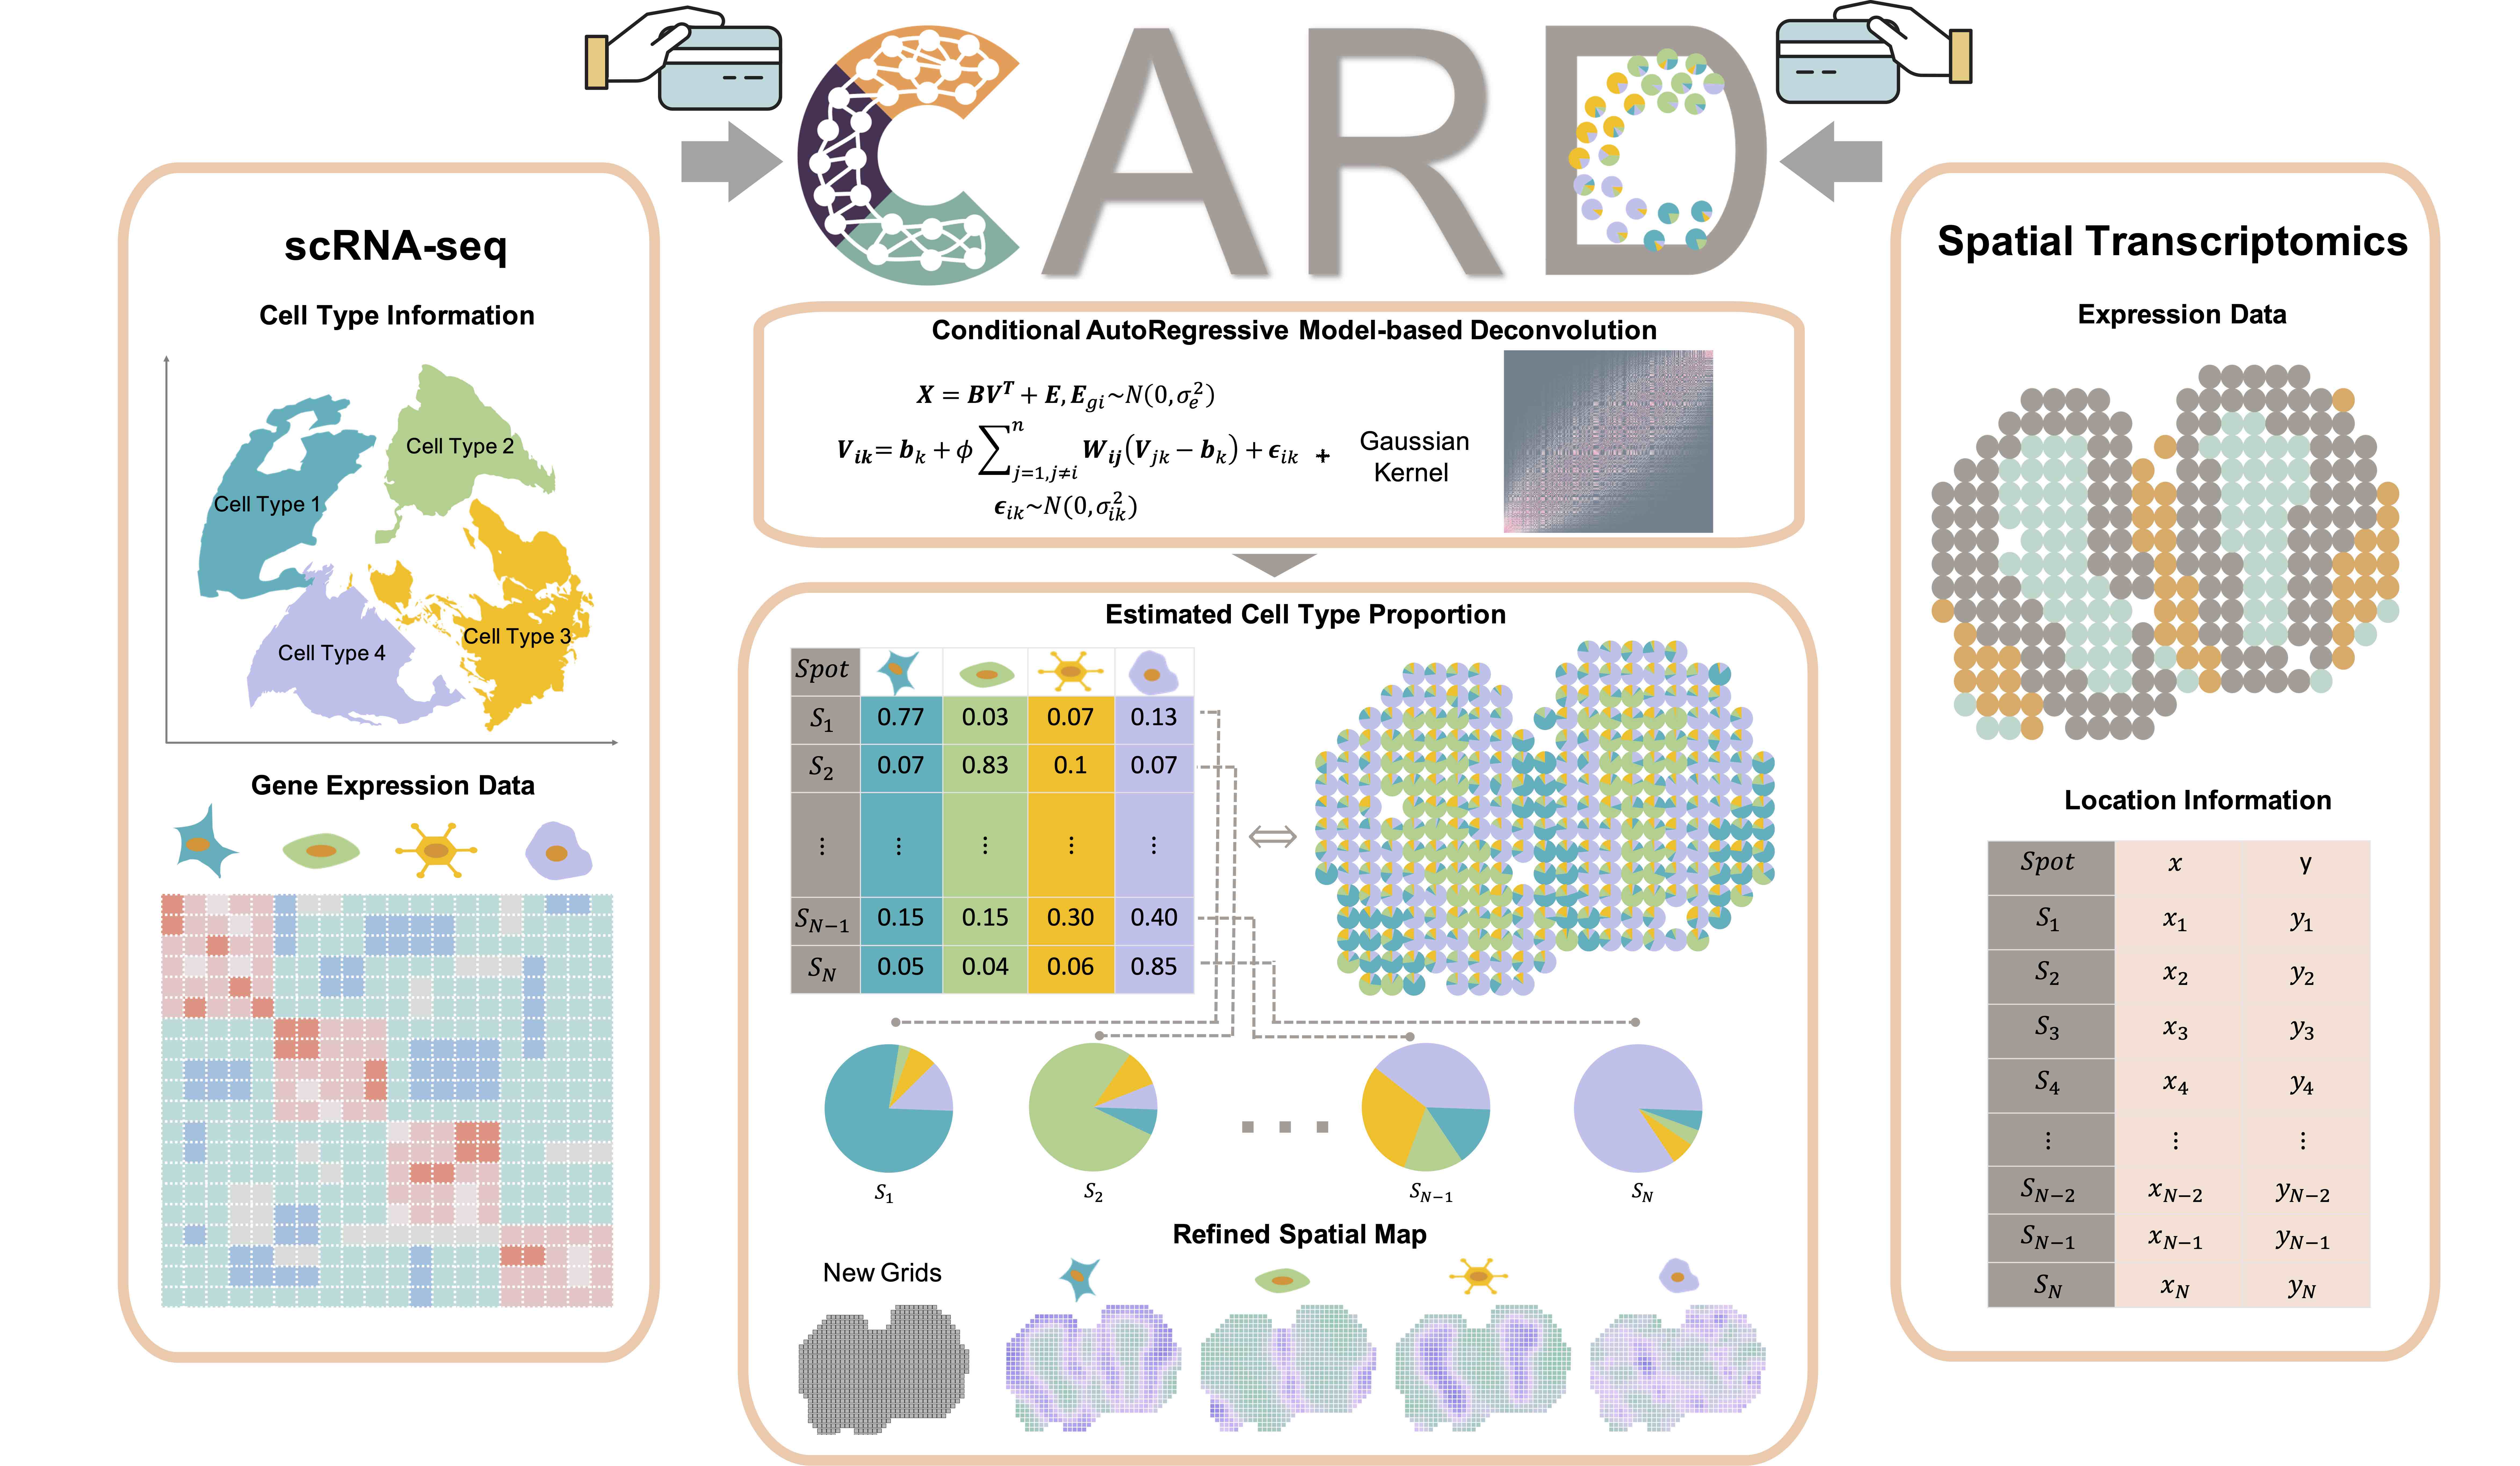
To achieve both cell type deconvolution and refined spatial map construction, we developed a deconvolution method, called conditional autoregressive-based deconvolution (CARD), that combines cell type–specific expression information from scRNA-seq with correlation in cell type composition across tissue locations (Figure 1). Specifically, CARD links the spatial transcriptomics data with the mean gene expression reference basis matrix that was constructed from scRNA-seq through a non-negative matrix factorization model. CARD also relies on a CAR modeling assumption to accommodate the spatial correlation structure in cell type compositions across locations. The key idea of modeling spatial correlation structure in cell type composition in the CARD modeling framework was inspired by previous biological literatures that similar cell types colocalized spatially in the tissue as cell types are segregated in a spatially correlated fashion into tissue domains during their development. Through modeling spatial correlation structure, CARD achieves accurate and robust cell type deconvolution even with mis-specified scRNAseq references and can also help construct a refined spatial map with arbitrarily high spatial resolutions for both cell type composition and gene expression (Figure 1). In addition, and equally importantly, CARD can be extended to perform reference-free deconvolution, using only a list of marker gene names without a scRNA-seq reference, facilitating its wide application. All these features make CARD a unique and effective method that can help disentangle the spatial localization of cell types and facilitate comprehensive mapping of tissue architecture. More details of our work can be found in the paper

Paper
Spatially informed cell-type deconvolution for spatial transcriptomics
Paper Published in Nature Biotechnology
Selected important results by CARD
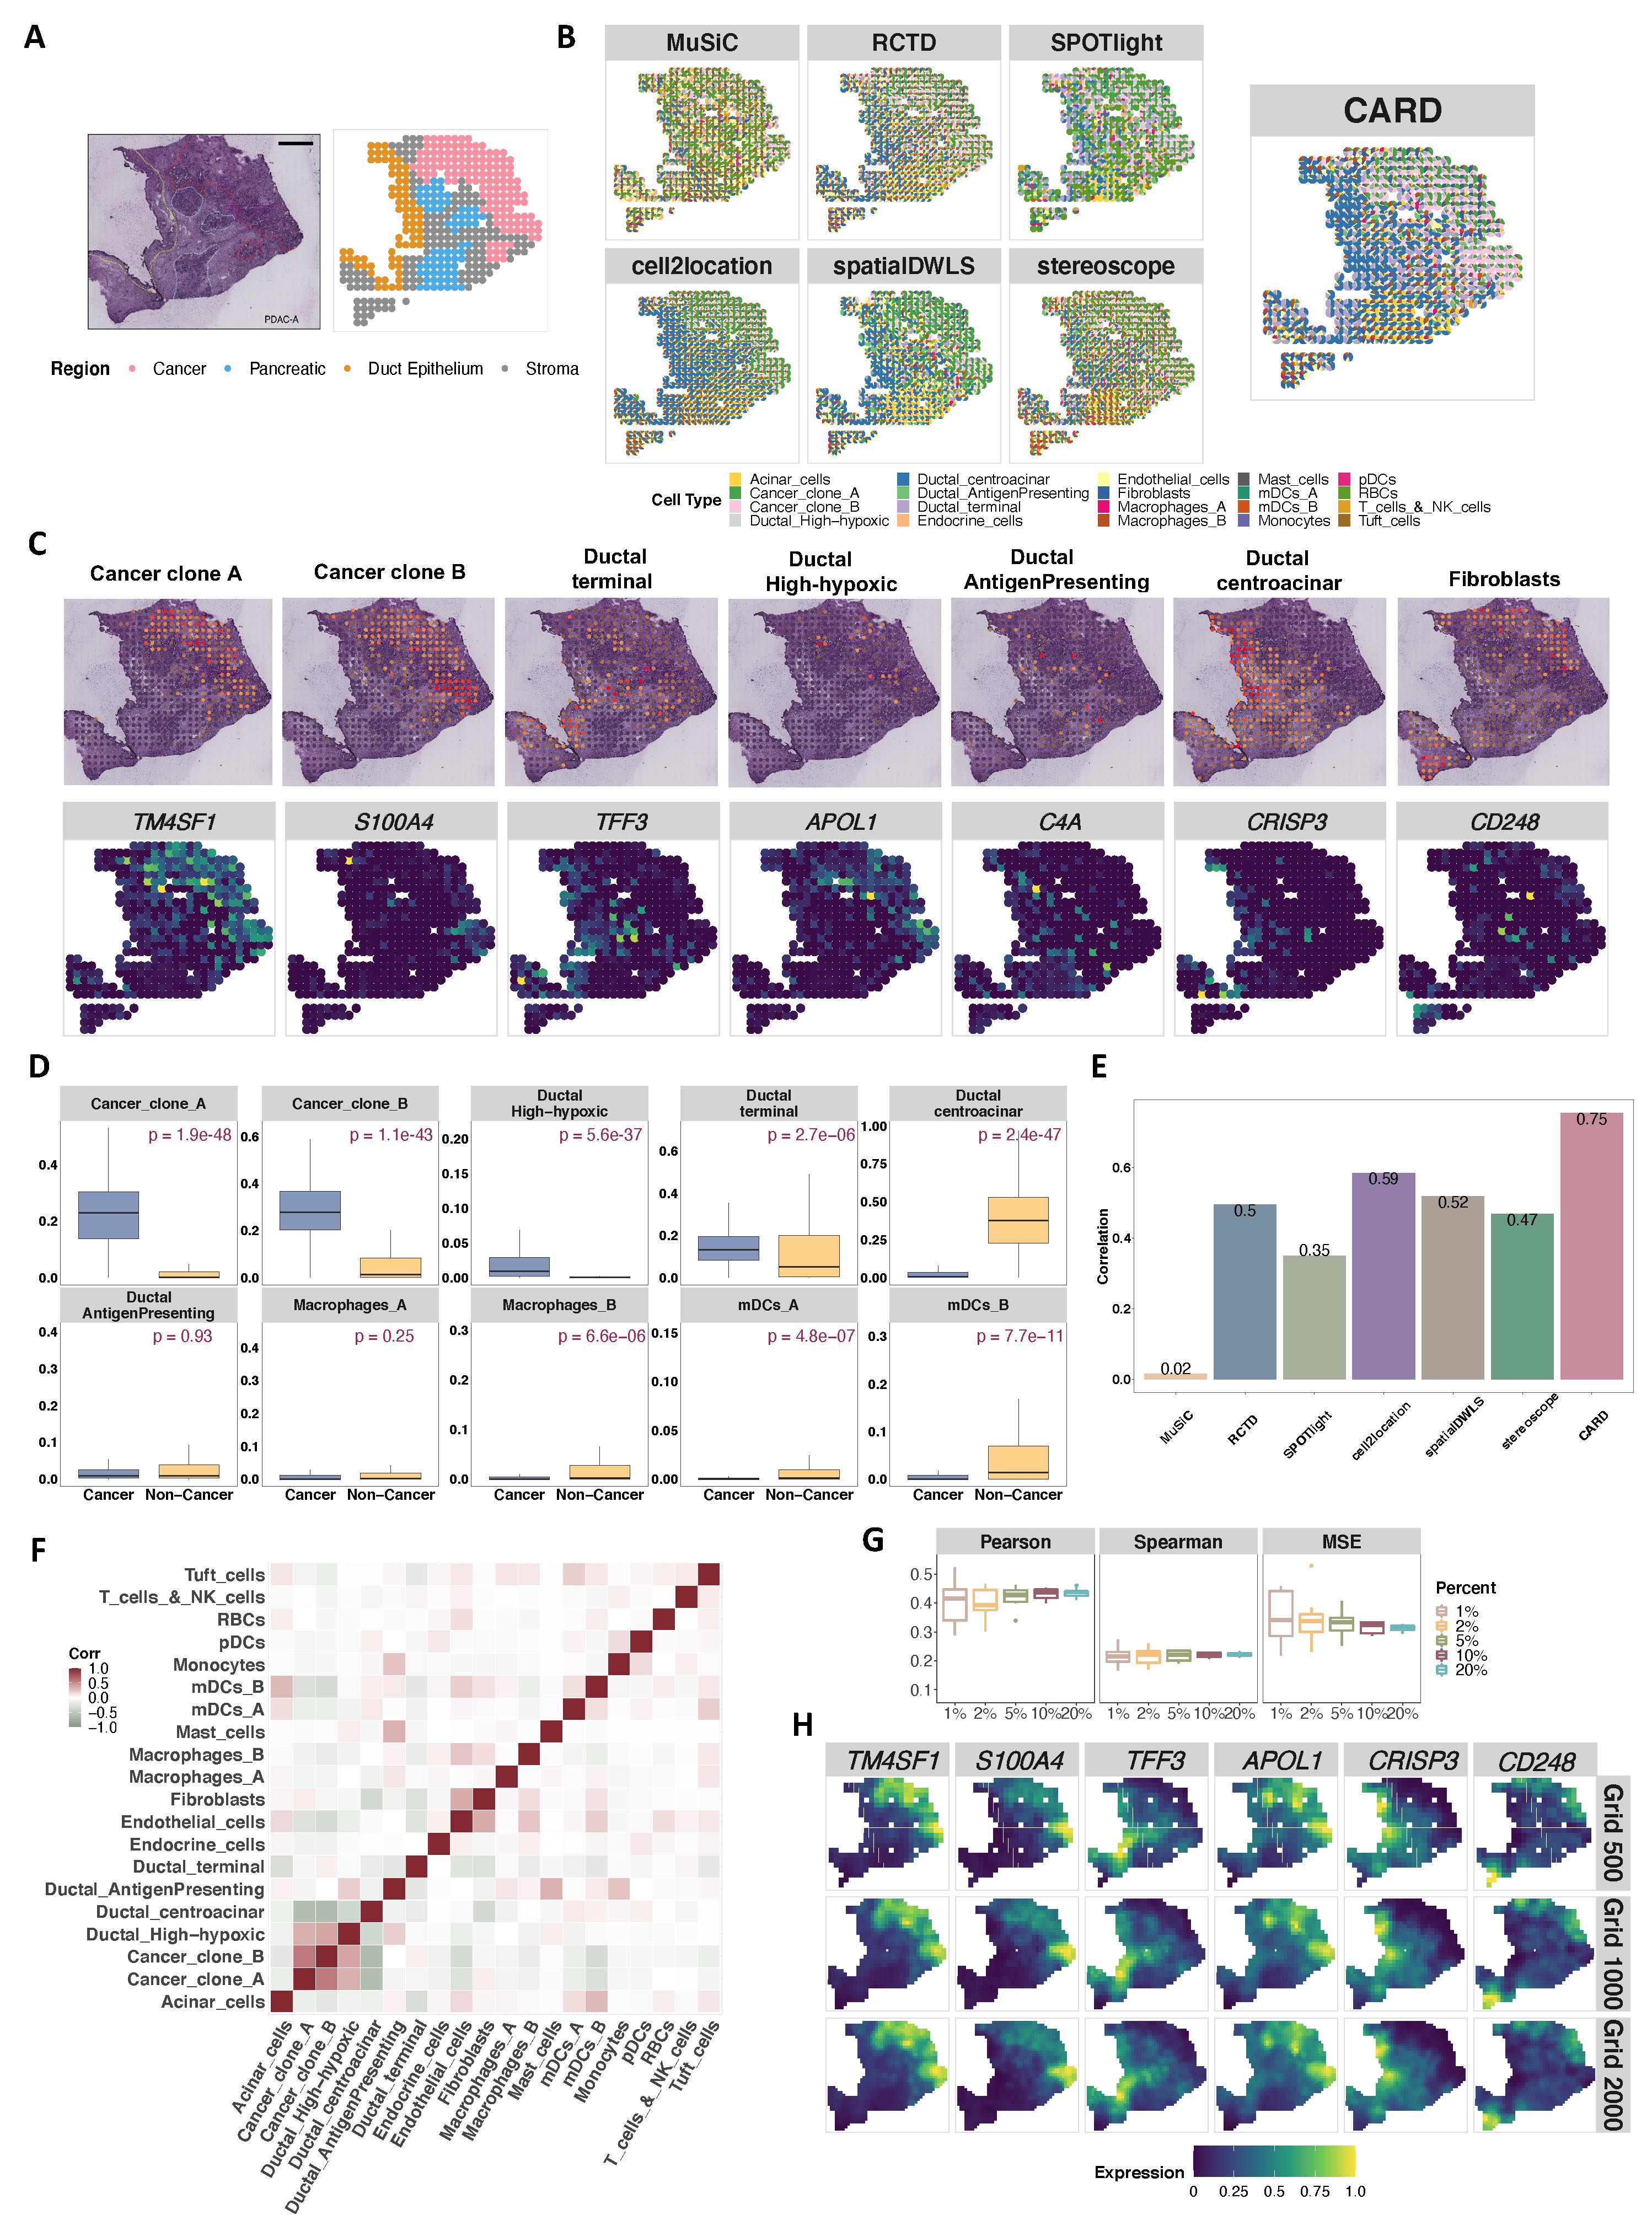
Analyzing the human pancreatic ductal adenocarcinoma (PDAC) data, CARD is abale to capture a gross regional segregation between cancer and non-cancer regions, between the ductal and stroma regions and between the pancreatic and ductal regions. CARD further divides the cancer region into two subregions, and localizes many other cell types into specific tissue regions, consistent with the expression pattern of the corresponding marker genes. Additionally, CARd also reveals the distinct distribution of two macrophage subpopulations between the cancer and non-cancer regions, representing a key functional signature of the regional compartmentalization of the cancer tissue that was missed by the other methods.

Tutorial of CARD
We provided a tutorial for running CARD in details, with all kinds of visualization plots provided. Package Website: CARD Tutorial
